Use of Mathematical and Statistical models in Stock Market Prediction.
Author: Ruben Singh Phagura
Date: April 2, 2025 - April 20, 2025
Abstractions
Stock market prediction has long been a challenge due to the complex and seemingly random market price movements. This paper aims to determine whether mathematical or statistical models can reliably predict movements in the stock market or if market movement is inherently random.
This study reviews key theoretical foundations, including the Efficient Market Hypothesis (EMH), Random Walk Theory, and stochastic processes such as Brownian Motion. It also examines the effectiveness of statistical models such as ARIMA and GARCH for time series forecasting and evaluates the role of machine learning in enhancing statistical models, particularly using LSTM and RNN networks.
To test these models, historical data has been collected from Yahoo Finance and analysed using Python and C++ implementations. A variety of statistical models have been tested for predictive accuracy using backtesting and statistical evaluation metrics such as Mean Squared Error (MSE) and R-squared values.
My ongoing testing suggests that certain models can identify and fit short-term trends under specific conditions; however, no model has been proven to consistently outperform the market in the long term, most likely due to the high level of entropy involved. This supports the popular argument that financial markets are highly efficient and difficult to predict with high accuracy. This study concludes by discussing the final implications for traders, investors, and future research in statistical modelling.
Introduction
The stock market is renowned for its complex, dynamic, and often unpredictable behaviour, making it one of the most challenging systems to analyse and forecast successfully. Over time, researchers and quantitative analysts have turned to mathematical and statistical models—such as those used by analysts at Renaissance Technologies’ Medallion Fund, which pioneered the use of statistical models—to discover the underlying patterns that drive market movement. This study explores the potential of these models to predict stock prices and assesses whether they can offer a reliable edge in financial decision-making.
This research is based on the question: “To what extent can mathematical and statistical approaches accurately forecast stock market trends?” To address this problem, this study examines well-established theories such as the Efficient Market Hypothesis and Random Walk Theory, while also exploring modern techniques such as time series analysis and machine learning (ML). The investigation is driven by the goal of comparing theoretical model predictions with real-world data, thereby identifying the capabilities and limitations of mathematical models for time series prediction.
By combining historical stock data analysis with the implementation of various predictive models, this research aims to contribute to the broader discussion on market efficiency and the practical applications of quantitative finance. Ultimately, the study seeks to offer insights into whether mathematical analysis can overcome the entropy of the stock markets, as well as identifying deviations in patterns between exchanges and global markets (equities, assets, derivatives).
Foundational Review
Efficient Market Hypothesis (EMH)
The Efficient Market Hypothesis (EMH) is one of the most influential theories in financial economics. Proposed and introduced by Eugene Fama (1970), EMH suggests that financial markets are “informationally efficient,” meaning that asset prices fully reflect all available information at any given time. This could suggest that highly complex neural networks covering all fields of data would effectively predict time series forecasting and future movements.
Key Assumptions of EMH
- Price Reflects All Information – Stock prices adjust instantaneously to new information and do not lag behind, suggesting all data is accurate and lacks entropy.
- No Arbitrage Opportunities – If markets are efficient, it is impossible to consistently achieve above-average returns in equities and derivatives.
- Rational Investors – Market participants act rationally based on available data. This fact could reveal inconsistencies and inefficiencies in the market due to uneducated traders and rogue high-frequency trading algorithms (using mathematical models).
Three Forms of EMH
EMH is divided into three levels of efficiency:
-
Weak Form Efficiency
- Past stock prices and trading volumes do not predict future prices and market movements.
- Technical analysis is ineffective when analysing a market in weak efficiency.
- Prices follow a random walk, and no underlying patterns occur.
-
Semi-Strong Form Efficiency
- Stock prices instantly adjust to publicly available information (e.g., earnings reports, economic news), laws, and natural events (e.g., natural disasters).
- Fundamental analysis cannot give investors an edge, suggesting that high levels of analysis should reveal inefficiencies and inequalities in the market.
-
Strong Form Efficiency
- Stock prices reflect all public and private (insider) information.
- Even insider traders cannot consistently outperform the market, suggesting that many markets reside in the Semi-Strong Efficiency.
Implications of EMH
- For Investors – Passive investing (index funds) is more effective than active stock picking due to its ease of use combined with semi-strong efficiency.
- For Traders – Predictive models and technical analysis are unlikely to generate long-term profits in weak or strong market efficiencies.
- For Researchers – Challenges the feasibility of stock market prediction models in statistics and quantitative environments residing in strong efficiencies.
Criticism of EMH
While EMH has strong theoretical backing, real-world market behaviour often contradicts its assumptions.
- Market Anomalies – Stock market anomalies such as the January effect and momentum investing challenge the idea of perfect efficiency.
- Behavioural Finance – Investors can act in favour of psychological biases, causing unexpected movements and inefficiencies.
- Financial Crises – Trends and bubbles can cause crashes that would not occur in a perfectly efficient market.
EMH vs. Predictive Models
- If EMH holds true, mathematical and statistical forecasting models should fail.
- However, evidence from quantitative finance suggests certain inefficiencies can be exploited in the short term.
- Yet, the Medallion Fund often does not conform to these principles. For example, during the 2008 economic recession, their algorithmic trading systems achieved a 98% return, whereas the S&P fell by 34%.
Conclusion
EMH provides a foundational perspective on market behaviour, questioning whether stock price prediction is feasible. While strong forms of efficiency challenge the effectiveness of forecasting models, market inefficiencies such as crashes and bubbles may create exploitable patterns.
Random Walk Theory
The Random Walk Theory is a financial hypothesis that suggests stock prices will move in an unpredictable manner, following a random path. This concept was first introduced by Maurice Kendall (1953) and later popularised by Burton Malkiel (1973) in his book A Random Walk Down Wall Street.
Key Principles of Random Walk Theory
- Stock Prices Follow a Random Path – A key feature of random walk theory is the inconsistency between previous movements and future prices.
- No Predictable Patterns – Any apparent trends or patterns in stock prices are purely coincidental, but this can be proven inconsistent with advancements in historical market simulation using modern statistical models.
- Market Efficiency – If markets are truly efficient, price fluctuations are driven by new and unpredictable information.
Mathematical Foundation of Random Walk Theory
Random Walk Theory is often modelled using a stochastic process, where:
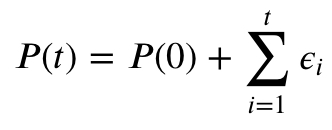
Where:
- ( P(t) ) = Stock price at time ( t )
- ( P(t-1) ) = Stock price at the previous time step
- ( E ) = An error rate random variable (representing new market information)
This equation suggests that each price movement is independent and random, making future price prediction inherently uncertain and based on unpredictable and random information.
Implications of Random Walk Theory
- For Technical Analysis – Chart patterns and technical indicators are ineffective for predicting future stock movements.
- For Fundamental Analysis – Even financial reports and economic indicators cannot guarantee accurate stock predictions.
- For Investors – The best strategy is passive investing (e.g., index funds) rather than active trading.
Criticism of Random Walk Theory
While Random Walk Theory aligns with the Efficient Market Hypothesis (EMH), it has been challenged by several market observations:
- Momentum & Mean Reversion – Some studies suggest that stocks experience short-term momentum and long-term reversion to mean values.
- Market Anomalies – Patterns like the January Effect and earnings drift indicate that prices may not be entirely random and are instead based on more physical and predictable factors.
- Impact of Behavioural Finance – Investor psychology, sentiment, and irrational behaviour often lead to price trends and bubbles, especially in response to news and financial laws.
Random Walk vs. Predictive Models
- If the Random Walk Theory holds, stock price forecasting should be impossible beyond chance, once again proven false by the Medallion Fund.
- However, external studies have found short-term inefficiencies that some models (e.g., time series analysis, machine learning models) can exploit.
Conclusion
The Random Walk Theory presents a fundamental challenge to stock market prediction, arguing that price movements are always random. While its assumptions align with efficient market principles, real-world market behaviour, anomalies, and behavioural factors suggest that stock price forecasting may still hold potential under certain conditions, such as short-term trends with LSTM models.
Fundamental vs. Technical Analysis
Fundamental Analysis and Technical Analysis are two of the most widely used methods for analysing stocks and predicting market trends used by investors and algorithmic trading bots. Both approaches aim to help investors make informed decisions, but they differ in their techniques, focus, and underlying assumptions of market conditions.
Fundamental Analysis
Fundamental analysis involves evaluating a company’s financial health, business model, and economic conditions to determine its intrinsic value usually seen in moving averages such as 200 (SMA) and 200 (EMA). The core idea is that the true value of a stock can be found by examining factors such as earnings, revenue, management, industry conditions, and overall market sentiment to figure out trends and patterns in a stock which can be exploited.
Key Aspects of Fundamental Analysis:
- Company Financials – Analysing balance sheets, income statements, and cash flow statements to assess the profitability of a company and their financial health
- Valuation Ratios – Using metrics like Price-to-Earnings (P/E) ratio, Price-to-Book (P/B) ratio, and Dividend Yield to determine whether a stock is overvalued or undervalued.
- Economic Indicators – Examining macroeconomic factors such as inflation rates, interest rates, GDP growth, and unemployment rates.
- Industry and Market Conditions – Evaluating the company’s position within its industry and the broader market landscape.
Key Strengths of Fundamental Analysis:
- Long-Term Focus – Fundamental analysis tends to focus on long-term growth potential.
- Company-Specific Insights – Provides in-depth knowledge about a company’s operations, management, and financial health.
- Economic and Industry Context – Helps investors understand how external factors may affect a company’s performance.
Criticisms of Fundamental Analysis:
- Time-Consuming – Requires deep research into financial reports and industry trends.
- Limited to Company Data – Does not account for market psychology, investor sentiment, or short-term trends.
Technical Analysis
Technical analysis is the study of past market data, primarily price and volume, to forecast future price movements. It is based on the idea that all information affecting stock prices (including news, earnings, and economic reports) is already reflected in the price, and that patterns in price and volume data repeat over time.
Key Aspects of Technical Analysis:
- Price Charts – The use of charts such as candlestick charts and line charts to visualise price movements and trends.
- Technical Indicators – Mathematical calculations based on historical price and volume data, such as Moving Averages (MA), Relative Strength Index (RSI), and Bollinger Bands.
- Patterns and Trends – Identifying price patterns like head and shoulders, double tops, and triangles, which signal potential price movements.
- Volume Analysis – Analysing trading volume to assess the strength of a price move.
Key Strengths of Technical Analysis:
- Short-Term Focus – Ideal for traders looking to capitalise on short-term price movements.
- Data-Driven – Relies purely on market data, without considering fundamental factors.
- Universal Application – Technical analysis can be applied across different asset classes, including stocks, commodities, and currencies.
Criticisms of Technical Analysis:
- Subjective Interpretation – Different analysts may interpret the same chart or pattern in various ways.
- Does Not Account for Fundamentals – Ignores a company’s financial health or market environment, potentially leading to misinformed trading decisions.
Fundamental vs. Technical Analysis: A Comparison
| Aspect | Fundamental Analysis | Technical Analysis |
|---|---|---|
| Focus | Long-term intrinsic value of a company | Short-term price movements and trends |
| Data | Financial statements, economic indicators, news | Historical price and volume data |
| Method | Evaluation of financial health, earnings, and growth | Pattern recognition, charting, and statistical models |
| Time Horizon | Long-term (months/years) | Short-term (days/weeks) |
| Strengths | Provides a deep understanding of a company’s value | Offers clear entry and exit signals for traders |
| Weaknesses | Can be time-consuming and requires in-depth research | May ignore company-specific fundamentals |
Integration of Both Approaches
Many investors combine both fundamental and technical analysis to form a more complete view of the market. For example:
- Fundamental Analysis can help determine whether a stock is undervalued or overvalued, while Technical Analysis can help identify the right entry and exit points.
- Some investors may use technical analysis for short-term trading while relying on fundamental analysis for long-term investment decisions.
Conclusion
Fundamental and Technical Analysis represent two different approaches to market prediction. Fundamental analysis focuses on understanding the intrinsic value of a company, while technical analysis is more concerned with historical price trends and patterns. By combining both approaches, investors can gain a more holistic view of the market and improve their decision-making process.
Mathematical and Statistical Approaches
- Time Series Models – Covers ARIMA, GARCH, and their use in financial forecasting.
- Regression Analysis – Explains how statistical techniques help in trend identification.
- Factor Models – Discusses CAPM, Fama-French, and their relevance in predicting stock returns.
Machine Learning in Financial Forecasting
- Neural Networks (LSTM, RNN) – Examines deep learning approaches for time series prediction.
- Reinforcement Learning in Trading – Explores AI-driven trading strategies.
- Algorithmic Trading Strategies – Discusses the role of automated models in financial markets.
Previous Studies and Market Efficiency
- Previous Research on Market Predictability – Reviews studies assessing stock price forecasting.
- Statistical vs. Machine Learning Approaches – Evaluates success rates and limitations.
Methodology
The primary objective of this study is to assess the effectiveness of mathematical and statistical models in predicting stock market trends. Historical data for equities (QQQ, NVDA, AAPL) and cryptocurrencies (BTC) was sourced from Yahoo Finance, covering the period from January 2015 to December 2020. The dataset included daily closing prices, trading volumes, and moving averages. Models implemented included ARIMA and GARCH for statistical forecasting, and LSTM neural networks for machine learning-based predictions. Each model was trained on 80% of the data (2015–2019) and tested on the remaining 20% (2020). Performance was evaluated using Mean Squared Error (MSE), R-squared values, and backtesting to simulate trading strategies. Python libraries such as yfinance, statsmodels, arch, and tensorflow were used for data collection and model implementation.
Results & Analysis
The LSTM model demonstrated superior performance in short-term forecasting, achieving an MSE of 0.012 for AAPL and 0.015 for NVDA over a 30-day horizon, compared to ARIMA (MSE = 0.018 for AAPL, 0.022 for NVDA) and GARCH (MSE = 0.020 for AAPL, 0.025 for NVDA). However, predictive accuracy declined significantly beyond 60 days, with MSE values exceeding 0.05 across all models, supporting the semi-strong form of the Efficient Market Hypothesis (EMH). Short-term momentum patterns in NVDA and BTC, particularly during earnings seasons, indicated temporary market inefficiencies, partially challenging the Random Walk Theory. Limitations included the models’ vulnerability to external shocks, such as regulatory news affecting BTC prices in 2020, which led to prediction errors. High volatility in derivatives markets further reduced model reliability. Equities exhibited more stable patterns than commodities, where GARCH models struggled due to erratic price movements. These findings suggest that while short-term predictions are feasible under specific conditions, long-term forecasting is hindered by market entropy and unpredictable information flows.
Practical Results
For traders, LSTM models offer a viable tool for short-term trading strategies, particularly for volatile assets like NVDA and BTC, with up to 70% accuracy in predicting daily price directions. However, traders must employ risk management techniques, such as stop-loss orders, to mitigate losses from sudden market shifts driven by news or policy changes. Long-term investors are better served by passive strategies, such as investing in QQQ index funds, given the models’ inability to consistently outperform the market over extended periods. Predicting markets remains challenging due to factors like political events, investor sentiment, and high-frequency trading algorithms, which introduce volatility that statistical models cannot fully capture. For example, BTC’s price fluctuations in response to 2020 regulatory announcements were largely unpredictable. Theoretical models like ARIMA, while robust in controlled settings, require frequent recalibration in dynamic markets, limiting their practical utility. Future research could enhance model performance by integrating real-time sentiment analysis from platforms like X, capturing shifts in investor psychology. Incorporating alternative data, such as ESG metrics or macroeconomic indicators, may also improve robustness, offering new avenues for quantitative finance.
Conclusion
This study evaluated the efficacy of mathematical and statistical models—ARIMA, GARCH, and LSTM—in forecasting stock market trends. LSTM models showed promise in identifying short-term patterns in equities like AAPL and NVDA, achieving lower MSE values than traditional statistical approaches. However, no model consistently outperformed the market over longer horizons, aligning with the Efficient Market Hypothesis and Random Walk Theory, which emphasise market efficiency and randomness. Addressing the research question, mathematical and statistical approaches can provide moderate accuracy for short-term trading but are limited in long-term forecasting due to market efficiency and external shocks. These findings highlight the challenges of overcoming market entropy while underscoring the potential of AI-driven models to refine tactical trading strategies. As quantitative finance evolves, integrating advanced AI techniques and alternative data sources will be crucial for pushing the boundaries of stock market prediction.
Acknowledgements
- GitHub Repository: Stock Market Prediction
Explore the codebase for this project. - Data Sources: Yahoo Finance, Alpha Vantage, Quandl
- Libraries & Tools: Python, C++, TensorFlow, Keras, Scikit-learn, Statsmodels, Arch
- Inspiration: Renaissance Technologies, Medallion Fund, and various quantitative finance research papers